Measuring research quality: THE vs QS
Sept. 28, 2026 | By Billy Wong
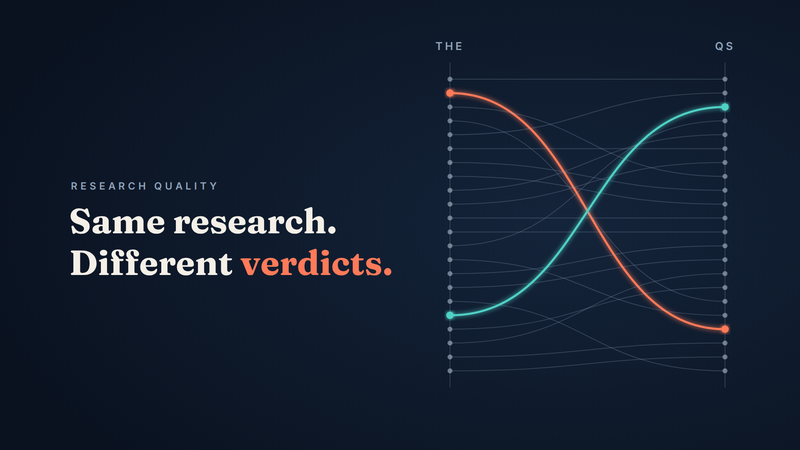
Having spent a decade as principal data scientist at THE, people often asked me why the same university could look so completely different depending on whether you checked THE or QS. The short answer? The two rankers measure research quality through entirely different lenses.
Take the QS World University Rankings 2027. Daegu Gyeongbuk Institute of Science and Technology (DGIST) scored a perfect 100 on Citations per Faculty. That matched MIT and Harvard, and beat Oxford (89.0) and Cambridge (87.4). Its overall rank was joint 385th.
Was it genuinely the best research university on the planet that year? Well, that depends entirely on how you define research quality in the first place.
On 30 September, THE publishes its World University Rankings 2027. Research quality accounts for 30% of their overall score, whereas QS assigns a 20% weight to Citations per Faculty. Within hours of release, university leaders will inevitably face questions about why their institution moved up or down.
Both rankers draw from the exact same raw data. They arrive at different outcomes because of fundamental design choices, each subtly favoring certain types of institutions over others. Understanding those underlying dynamics matters far more than any single ranking spot.
The one difference that matters
Let's be clear: neither ranker actually reads the papers. Instead, both tally citations, i.e. how frequently other scholars reference a publication, using Elsevier's Scopus database. While a citation proves that a paper was noticed and referenced, it tells us very little about whether the findings are correct, groundbreaking, or beneficial to society.
That's where the paths diverge. THE evaluates how well-cited a typical paper is relative to global peers in the same field, while QS calculates how much cited research each academic staff member produces.
Put simply: THE focuses primarily on impact per paper, whereas QS multiplies output and impact per capita.
To illustrate how this plays out, consider two hypothetical universities (the numbers are simplified, but the underlying mechanics reflect reality):
| None | Specialist Institute | Comprehensive University |
|---|---|---|
| Academic staff | 400 | 4,000 |
| Papers over five years | 4,000 (10 per head) | 20,000 (5 per head) |
| Citation per paper, against the world average for its field | 1.0 (average) | 1.5 (50% above average) |
| Citations per head, relative to field | 10.0 | 7.5 |
| Which ranker favours it | QS | THE |
Notice the difference: the Comprehensive University's average paper gets cited 50% more often, which THE heavily rewards. On the flip side, the Specialist Institute's staff publish twice as much per person, generating far higher citations per capita—an approach that QS favors.
Neither system is inherently wrong here. They're simply answering different questions.
Specifically, THE splits its 30% weight across four distinct metrics: average citation impact (15%), research strength (5%), research excellence (5%), and research influence (5%). QS, meanwhile, relies on a single Citations per Faculty metric worth 20%. Four key design choices account for most of the divergence between them.
Four design choices, and who each one favours
What you divide by: papers or people
QS calculates its ratio by dividing total citations by academic staff headcount. THE, by contrast, divides primarily by paper count across its main metrics, bringing staff numbers into play only for its 5% research excellence component.
This distinction determines who benefits from high publication frequency. A lean research institute whose faculty publish heavily gets a double boost under QS—more papers and more citations per staff member—which goes a long way toward explaining IISc's perfect score. THE accounts for high productivity separately through a distinct 5.5% research productivity metric, keeping it isolated from the core research quality evaluation.
Conversely, the QS approach disadvantages institutions with large teaching-focused faculties, since every academic counts toward the denominator regardless of research allocation. A teaching-led university producing a small volume of outstanding papers can score exceptionally well per paper, yet appear heavily diluted on a per-head basis.
This setup also introduces sensitivity to internal institutional reporting. Should postdocs, clinical faculty, or grant-funded researchers count as core faculty? A June 2026 study by Junjie Shen at the University of Bath demonstrated how subtle classification shifts alone could swing a university's score from 90 to 100.
Going back to our simplified scenario: if the Specialist Institute reclassifies 50 research-only staff so they aren't counted as faculty, its actual research output remains unchanged, yet its QS Citations per Faculty score instantly jumps by 14%.
What counts as comparable paper
Citation conventions vary dramatically across disciplines. A standard cell biology paper naturally gathers far more citations than a typical study in history or pure mathematics. Older publications have had years to accumulate citations, and review papers systematically draw more references than primary research. To account for this, both rankers normalize papers against peer benchmarks—though they handle normalization quite differently.
THE uses Field-Weighted Citation Impact (FWCI), comparing each paper against global benchmarks for the exact same subject, publication year, and document type across more than 300 Scopus categories. An FWCI of 1.0 indicates that a paper matches the global average for its specific peer group.
QS groups research into five broad faculty areas (Arts & Humanities, Engineering & Technology, Life Sciences & Medicine, Natural Sciences, and Social Sciences & Management), weighting them equally at 20% each. Crucially, QS does not adjust for publication year within its five-year window.
Two types of institutions feel this methodological gap most acutely.
First are universities strong in fields with lower baseline citation rates, such as nursing, mathematics, or civil engineering. THE evaluates their work strictly against discipline-specific norms, whereas QS compares them against broad faculty groupings that include high-citation neighboring fields.
Second are rapidly expanding universities. In QS, a paper published early in the window has had six years to gather citations, while a recent paper has had only one or two. Rapid growth skews publication profiles toward newer, less-cited papers, pulling down the overall ratio. Adding new faculty increases the denominator instantly, whereas citation accumulation takes time. On top of that, QS applies multi-year smoothing, meaning genuine performance gains can take several editions to fully register.
That said, THE's method isn't without drawbacks: newly published papers have so few total citations that their FWCI scores can exhibit sharp volatility.
A lesser-known detail involves journals categorized by Scopus as multidisciplinary (like Nature or Science). QS reassigns these papers to specific subject areas—and if a paper can't be mapped cleanly, it gets dropped from the citation tally altogether.
What to do with exceptional papers
Citation distributions are notoriously skewed. Most papers receive modest citation counts, while a tiny fraction become massive outliers. A simple mean average can be wildly distorted by a handful of mega-cited papers, particularly at smaller institutions.
This isn't just a theoretical vulnerability. In the 2010 THE rankings, Alexandria University ranked 147th overall and 4th globally for citations, ahead of Harvard and Stanford. That anomaly was largely driven by a single prolific researcher who published over 300 articles in a journal he edited, accumulating massive self-citations.
To address this, THE overhauled its methodology in 2024, cutting the weight on mean citation impact from 30% to 15% and introducing three complementary metrics:
- Research strength tracks the 75th percentile of field-normalized citations. By looking three-quarters of the way up an institution's ranked publications, extreme outliers at the top end can no longer distort the score.
- Research excellence measures the proportion of papers landing in the top 10% globally, adjusted for subject, year, and staff size.
- Research influence considers citation source quality, assigning higher weight to citations originating from influential papers.
To see how this works, imagine giving both hypothetical institutions ten massive hit papers cited at 100 times the global average. The Specialist Institute's mean average score jumps 25%, while the Comprehensive University's rises just 3%. In both cases, however, their 75th-percentile Research Strength barely budges.
QS takes a different approach to outlier management: highly cited papers get absorbed within large overall citation totals, multi-year smoothing cushions sudden spikes, and self-citations are excluded across the board.
What to do with very large collaborations
High-energy physics, genomics, and global health research frequently produce papers with hundreds or thousands of co-authors. If counted at full value, a single hyper-collaborative paper can dramatically transform a small institution's citation metrics.
THE handles papers with over 1,000 authors by applying fractional counting, while guaranteeing that each participating university receives at least 5% credit.
QS, on the other hand, excludes papers that exceed subject-specific institutional caps (ranging from 11 institutions in anthropology to 20 in agriculture), setting thresholds aimed at filtering out no more than 0.1% of published research in any given field.
As a result, institutions investing heavily in large international scientific consortia receive partial credit under THE, whereas QS excludes those papers entirely once they surpass the threshold.
Who wins and who loses
| Institution profile | Tends to fare better in | Why |
|---|---|---|
| Lean, research-intensive science or technology institute | QS | High output per head is rewarded twice: more papers, and more citations, per member of staff |
| Large university with many teaching-focused staff | THE | THE divides mainly by papers. QS divides by every academic, including those with little research time |
| Teaching-led university with small pockets of excellent research | THE | A small body of well-cited work scores well per paper. Per head, it is diluted |
| Strong in lower-citation fields, such as nursing, mathematics or civil engineering | THE | THE compares each paper with its own field. QS compares it with its whole broad area, including high-citation neighbours |
| Partner in very large international collaborations | THE | THE gives partial credit for papers over 1,000 authors. QS removes papers above its affiliation cap |
| Growing its research output or staff quickly | THE | In QS, recent papers have had little time to gather citations, while new staff count at once. THE compares each paper with others from the same year |
| Improving quickly | THE | QS damping holds back gains for several editions |
| Small, with a few exceptional papers | Varies | Still a source of volatility in THE's citation impact, now partly checked by the other three measures |
What both approaches miss
Despite their methodological differences, both systems share fundamental blind spots because they rely on the same underlying data provider.
- Monographs and creative outputs are underrepresented. Because Scopus focuses primarily on peer-reviewed journals, books, exhibitions, performances, and policy documents receive minimal visibility.
- English-language publications hold an advantage. Scopus indexing heavily favors English-medium journals. When Sorbonne University withdrew from THE rankings in 2025, leadership explicitly highlighted structural bias against non-English social sciences and humanities research.
- International collaboration boosts scores. Cross-border co-authored papers systematically draw higher citation counts, giving institutions with extensive global research networks an advantage in both systems.
- Scale is rewarded elsewhere in the ecosystem. Neither citation metric directly rewards sheer institutional size, but large, well-known universities capture that advantage through academic reputation surveys—which account for 18% of THE's overall score and 30% of QS's.
The broader implications
Identical performance yields divergent narratives. An institution can advance on one metric while dropping on the other in the exact same cycle without any change in underlying research quality. Governing boards that treat either ranking as an absolute truth risk drawing flawed strategic conclusions.
Metrics drive institutional behavior. Each methodology creates distinct incentives. Per-capita ratios encourage gaming around faculty definitions—as Shen observed, ranking indicators inevitably influence how staff get classified and reported. Per-paper averages, meanwhile, can discourage scholars from publishing useful applied work in local journals out of fear of pulling down institutional averages.
Where funding or policy depends on rankings, behavior shifts quickly. A 2024 study on Ukrainian universities showed that tying state funding to rank position led to influxes of lower-tier journal and conference submissions. As volume grew in lower-impact venues, overall citation impact dropped—and researchers noticed discrepancies in reported faculty counts relative to actual staffing levels.
Systemic incentives compromise research diversity. Both systems favor English-language journal articles in Scopus-indexed fields. Leaders who optimize specifically for rankings risk reallocating resources away from the humanities, practice-based research, and local-language scholarship.
Institutional pushback is gaining momentum. Utrecht University withdrew from THE rankings in 2023, followed by the University of Zurich in 2024 and Sorbonne University in 2025. Six Indian Institutes of Technology have opted out since 2020, and 52 South Korean universities launched a joint boycott of QS in 2023 following methodological changes.
At the same time, over 800 institutions have signed the Coalition for Advancing Research Assessment (CoARA), whose core commitments explicitly warn against using commercial university rankings in research evaluation.
Rank movement often reflects methodological shifts. THE completely overhauled its research metrics for 2024, while QS uses multi-year smoothing. When a university's rank shifts significantly, the first thing to check is whether the methodology changed before assuming research performance did.
What this means for university leaders
If you want to know how well-cited the typical publication is, THE's multi-metric basket provides a more robust, harder-to-game signal. If you're asking how research-intensive an institution is per staff member, QS's ratio gets closer to the mark.
Both are valid questions. Trouble arises only when either metric gets treated as a complete measure of "research quality" in isolation.
Here are five actionable recommendations for institutional leaders:
- Brief leadership on what each ranking actually measures. Set expectations before results drop—divergent movements across the two rankings are methodological artifacts, not contradictions.
- Analyze underlying distribution metrics. Compare your mean FWCI with your 75th percentile performance; a wide gap signals reliance on a few outlier papers. For QS, evaluate citation growth separately from headcount changes to identify true drivers.
- Maintain consistent, rigorous staff reporting. Apply staff definitions consistently year-over-year in strict alignment with ranker guidelines. Shifting definitions to boost ratios is easily spotted and harms institutional credibility.
- Audit and clean your Scopus profile. Fix split institutional profiles, misattributed papers, and missing affiliation links. Resolving metadata errors is the most cost-effective way to recover lost citations.
- Ground research strategy in mission-driven priorities. Treat commercial rankings as secondary indicators. Responsible evaluation frameworks like CoARA and DORA offer far healthier foundations for institutional strategy.
When the upcoming THE results drop on 30 September, remember: methodological mechanics will explain the outcomes just as much as the underlying research.
Which of these two methodologies aligns closer to your institution's reality? I'd welcome your thoughts and perspective.
Quick reference: the two methods side by side
| None | THE Research Quality | QS Citations per Faculty |
|---|---|---|
| Weight in overall score | 30%, across four measures | 20%, one measure |
| The question it answers | How well cited is the typical paper, against its own field? | How much cited research does each academic produce? |
| Data | Scopus: papers 2021 to 2025, citations to 2026 | Scopus: five years of papers, six years of citations |
| Subject comparison | Each paper against the world average for its field, year and type | Five broad areas, weighted equally |
| Publication year | Each paper compared with papers from the same year | Not adjusted: older papers have had longer to gather citations |
| What it divides by | Mostly the number of papers; research excellence also uses staff numbers | The number of academic staff |
| Exceptional papers | The 75th percentile and top 10% measures limit their pull | Diluted in large totals; damping smooths sudden jumps |
| Very large collaborations | Over 1,000 authors: counted fractionally, at least 5% each | Above a subject-specific affiliation cap: removed |
| Country context | Half of citation impact is country-adjusted | Some country weighting in arts, humanities and social sciences |
Tags: Higher Education Research Assessment University Rankings